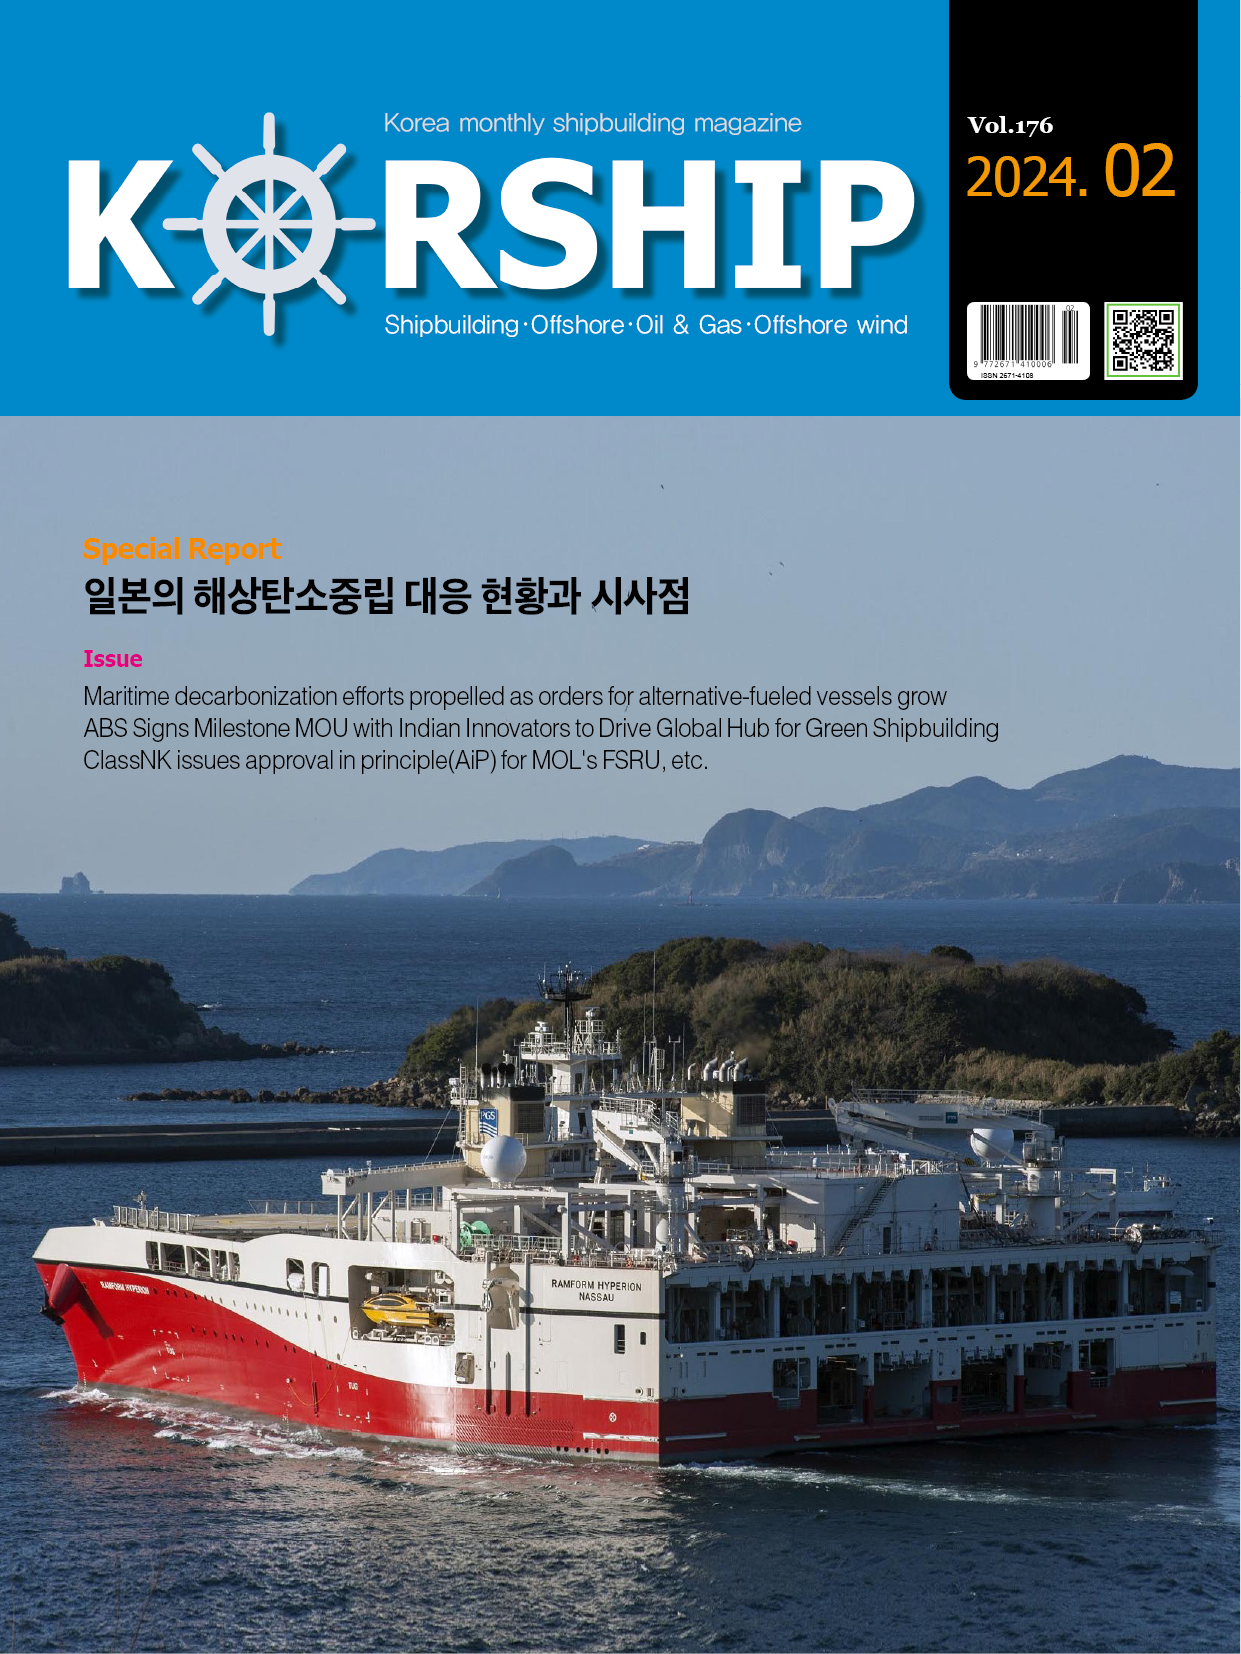
Feature Story Maritime CO2 Emissions
페이지 정보
작성자 최고관리자 댓글 0건 조회 1,834회 작성일 21-02-15 16:34본문
Maritime greenhouse gas emissions, accounting for approximately 3% of global CO2 emissions, have come under increased scrutiny in recent years, not least following the 2015 UNFCCC Paris Agreement. Several recent reports, including the 4th IMO Greenhouse Gas Study, have indicated an increase in maritime CO2 emissions in recent years. Marine Benchmark’s shipping statistics, spanning over 10-years of AIS data complemented with a suite of proprietary algorithms and other information, is uniquely positioned to support detailed bottom up emissions analysis. We confirm an upward trend in maritime CO2 emissions over recent years and provide analysis through September 2020 including the current pandemic. We also highlight the challenges facing the IMO in seeking to set the shipping industry’s CO2 emissions on a downward trajectory in the face of an aging fleet and historically low levels of newbuilding activity.
Introducing Marine Benchmark
Marine Benchmark is a Swedish-based company specialising in the capture and calculation of global shipping information and data. It was formed in 2012 by Torbjörn Rydbergh and Börje Berneblad, both with a wealth of maritime and “big data” application experience.
Marine Benchmark’s suite of products includes detailed information on individual vessels, through to aggregated fleet statistics, port and yard data products and bespoke analysis.
Marine Benchmark partners include the shipping brokerage Simpson Spence Young.
Emissions Methodology & Verification
Vessel CO2 emissions are calculated from the carbon content of the fuel consumed. Marine heavy fuel oil is approximately 86% carbon, which implies about 3.15 tonnes of CO2 per tonne of fuel consumed. Since the carbon content of diesel (gas oil) is slightly higher, so too are the CO2 emissions per tonne of fuel consumed.
Actual vessel fuel consumption depends on a range of factors, but primarily the hull, engine and propeller design, vessel displacement(draft), speed and fouling, as well as hydrological and meteorological conditions(including wind, waves and current). Marine Benchmark’s proprietary algorithms estimate vessel fuel consumption by main and auxiliary engines, based on these factors, utilising hourly AIS data for all IMO registered ships spanning over 10-years.
Verification is an ongoing and critical task, which is somewhat difficult considering the confidential nature of the data to vessel owners. Marine Benchmark relies on a combination of data, including confidential vessel daily logs for selected vessels and publicly available annual data, notably the EU MRV reports.
The release of the EU’s MRV data for 2018 and 2019 facilitated the first extensive verification with over 12,000 vessels reporting, albeit only on an annual basis and only applied to European port visits.
It should be noted that the EU MRV dataset is far from perfect. Since the comparison is annual, we apply several vessel filters to ensure that the EU MRV data covers a substantial portion of annual activity and isn’t limited to a brief, single voyage visit.
The following chart summarises Marine Benchmark’s calculated fuel consumption against the 2019 and 2018 EU reported MRV data.
Global Maritime CO2 Emissions
The results of Marine Benchmark’s analysis show that, between 2011 and 2019, international AIS-tracked maritime CO2 emissions rose at an average annual rate of 2.1% to approximately 800mt CO2 annually(fuel consumption for main engines and aux engines, without boilers). The current pandemic has weakened this growth to 1.7% as emissions in the first nine months of 2020 have fallen by approximately 2% from 2019 levels.
Marine Benchmark’s global estimates of a shallow upward trend in CO2 emissions are broadly in line with the 4th IMO Greenhouse Gas Study. However, as the chart below shows, the two differ over the direction of CO2 emissions in 2018, when Marine Benchmark’s analysis show that gains in efficiency were insufficient to fully offset the influence of sustained growth in fleet supply.
International emissions continue to be dominated by the ‘big three’ vessel types, which together account for 82% of international emissions. Between 2011 and 2019, tankers, bulkers and container vessel emissions grew at 3%pa, 2%pa and 0%pa, respectively. Over the same period, capacity increased 4% pa in each of these sectors.
The disconnect between fleet capacity growth, measured in deadweight terms, and emissions growth is highlighted in the following chart for the global fleet.
This wedge has been driven by several positive factors, including:
•Slower steaming speeds;
•Penetration of eco ship designs into new building;
•Increasing share of LNG fuel vessels; and
•A move towards larger vessels where improved economies of scale have also reduced fuel consumption per tonne transported.
These positive factors have lowered the carbon intensity of the shipping industry and brought the IMO’s dual goal of reducing CO2 emission per transport work by 40% between 2008 and 2030 tantalisingly close. Indeed, the latest GHG Study showed that some measures of international shipping’s carbon intensity have already declined by more than 30% since the baseline year of 2008.
Yet, despite these improvements, it is clear that aggregate CO2 emissions have resisted decline. On the contrary, the outright growth in international maritime CO2 emissions over the past decade, roughly 18% in total, will make it more difficult for the IMO to achieve its 2050 goal of halving international shipping CO2 emissions relative to 2008 levels. It may also prompt the introduction of more stringent regional emission regulations, notably in Europe, and thereby create a more complex regulatory framework.
Coronavirus 2019 Pandemic
The current CV-19 pandemic has added much uncertainty to maritime sector demand, with global economic growth falling sharply in 2020, reducing seaborne trade and CO2 emissions. The following chart, directly reflecting shipping activity, illustrates the increase in CO2 emissions in January and February, relative to 2019, followed by yearon-year declines as the pandemic took hold.
The effects of CV-19 have not been equal across shipping, with the cruise sector, passenger ferries and containers being hit particularly hard. Emissions from other sectors have been less dramatically impacted, partly due to continued expansion in fleet supply, but also some positive trade developments.
Outlook
The short-term outlook for shipping emissions will reflect demand, which remains heavily influenced by CV-19. However, consensus macroeconomic forecasts(fortified by recent improvements in hospital patient care and the prospect of a somewhat effective vaccine being developed), offer the probability that global demand will rebound strongly in 2021 and resume previous trajectories.
At the same time, relative to the existing global shipping fleet, the newbuilding orderbook is at its lowest in decades, as owners are faced with major uncertainties over (1) the outlook for world trade(exacerbated by this year’s pandemic), (2) the environmental regulatory environment and (3) the pace at which new ship designs, utilising alternative fuels, can be developed.
The current lack of newbuilding investment is set to compound supply-side trends established during the past ten years which, as shown in the following chart, has reduced fleet turnover.
The combination of low newbuilding deliveries, and a potential rebound in demand, implies limited scrapping activity over the next couple of years and, therefore, an aging fleet. As more older vessels remain on the water, the implication is that CO2 emissions are more likely to track fleet growth as the efficiency gains witnessed over the past decade taper. This is because (1) the new ecoship designs entering the fleet will represent an historically low proportion, (2) emission gains from slower steaming are exhausted and (3) the use of LNG as a transitory fuel remains small relative to the global fleet.
Such a prospect serves to highlight the importance of this month’s meeting of the IMO Marine Environment Protection Committee. Their deliberations will not only help to determine whether a downward trend in the shipping industry’s absolute levels of CO2 emissions can be established before 2030, but also whether the shipping industry faces a potential supply shock later in the decade as the fleet ages and newbuilding investors await technological breakthroughs.
■Inquiries: www.marinebenchmark.com

