Feature Story Natural Gas Measurement Using Temperature-Dependent Thermal Conductivi…
페이지 정보
작성자 최고관리자 댓글 0건 조회 2,254회 작성일 20-02-17 17:38본문
Natural gas has drawn attention in recent years due to the increasing diversification of the energy supply and interest in preserving the environment. As a result, there is a growing need to understand various indicators (of calorific value, etc) of natural gas and LNG, which change depending on the gas composition. To meet this need, we have developed a natural gas calorimeter which can output a fuel’s Wobbe index, methane number, density, etc., as well as its calorific value. We offer different models depending on the type of output required. In this paper we describe the natural gas measurement technology adopted for our calorimeter, temperature-dependent thermal conductivity.
1. Introduction
1.1 Trends in the natural gas market
At present the demand for natural gas is growing globally, and the number of power plants and gas engines that use natural gas as fuel is increasing. However, the composition of natural gas varies greatly depending on the place of production, because it is a mixture composed of methane (mainly), hydrocarbons such as ethane, propane, and butane, and noncombustible components such as nitrogen and carbon dioxide. In addition, as in the example of boil-off gas mixed with LNG, it is not rare that the properties of natural gas change when it is used. Therefore, to improve the efficiency of combustion equipment and engines, it is necessary to understand various indicators (calorific value, Wobbe index1, methane number2 etc.), which change depending on the gas composition, in real time.
1.2 Problems in natural gas measurement
Conventional calorimeters that utilize heat conduction and gas density meters that calculate oscillation frequency and are used as calorimeters cannot precisely measure a mixed gas containing noncombustible components such as nitrogen and carbon dioxide, because these components will cause error. Changes in ambient temperature and pressure are also error factors and affect device performance.
Many gas companies use gas chromatographs, which can measure a mixed gas containing noncombustible components with high precision, but analysis takes several minutes, and thus these instruments cannot be used for real-time monitoring. In addition, the measurement process of gas chromatographs requires a carrier gas (helium), and gas chromatographs are costly. For these reasons, the use of these instruments is not widespread.
In recent years, products that utilize the correlation between a combination of physical properties (thermal conductivity, density, etc.) and calorific value are also appearing on the market, but these products require multiple sensors and are relatively expensive, preventing them from becoming popular.
1.3 Features of the calorimeter
The calorimeter is a field device for measuring various parameters of natural gas, such as its calorific value, with a high-speed two-second output response.
Focusing on the differences in temperature characteristics of thermal conductivity for each component of natural gas, we developed a new measurement method. We change the temperature of the sensing element of a MEMS thermal sensor quickly to five different levels, and using the sensor signals at these temperatures, the calorimeter outputs values such as the calorific value or the methane number, which are calculated based on the correlation method.
To process the sensor signal, the calorimeter uses a characteristic equation that incorporates a support vector regression method devised by Azbil Corporation.
By adopting the new method based on the thermal conductivity at different temperatures, it is now possible to measure mixed gas containing noncombustible components with high accuracy. In addition, because only a single sensor is used, the electrical circuit and operation processing are simpler, allowing the cost to be reduced.
2. Measurement of thermal conductivity of gas
This section describes the structure and the method of driving the MEMS thermal sensor, and the method of measuring the thermal conductivity of the gas.
2.1 Structure of the MEMS thermal sensor
The calorimeter incorporates a MEMS thermal sensor developed and manufactured by Azbil Corporation.
Figure 1 shows the structure of the sensor.
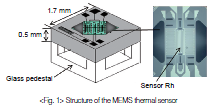
A bridge-shaped silicon nitride thin film is held in the air over the silicon chip of the sensor. Sensor Rh, made from a platinum film formed by vapor deposition, is set in the center of the silicon nitride film, which is only 1 μm thick.
Because the film is so thin, the temperature of the sensor stabilizes quickly, in several tens of milliseconds, when the drive voltage changes. If the sensor were large, natural convection would occur due to the difference in gas density, causing measurement error. Since the heated area of sensor Rh is only about 100 μm × 300 μm, natural convection can be minimized.
2.2 Method of driving the sensor
Figure 2 shows the circuit structure and the timing for driving the sensor. Five voltages are switched at precise chronological intervals to change the temperature of the sensor. The sensor output voltages are converted to digital sensor signals and sent to the CPU.
The CPU converts these signals to output values, such as the calorific value, using the regression equation, and outputs them as analog voltages through a DA converter (DAC).
2.3 Correlation between thermal conductivity and heat loss coefficient
From the actually measured sensor output voltage Vout, the heat loss coefficient that indicates the relationship between the power applied to the sensor and the rise in sensor temperature can be obtained [1].
The heat loss coefficient C is expressed by the following equation.
C = Ph / (Th - T0) (μW/°C) Equation (1)
Ph: Power applied to the sensor (μW)
Th: sensor temperature (°C)
T0: Ambient temperature (°C)
The heat loss coefficient indicates how much heat is radiated from the sensor to the gas. Its value varies depending on the thermal conductivity of the gas.
Figure 3 shows the relationship between the actually measured heat loss coefficient of the sensor and the thermal conductivity calculated from the composition of 23 mixed gases of different compositions. Since the heat loss coefficient and the thermal conductivity are closely correlated, the thermal conductivity can be measured using the sensor output voltage Vout.
Utilizing the above principle, the thermal conductivity of a mixed gas at five temperatures is measured by changing the sensor temperature in five steps, and using these sensor signals (Vout) as input values, output values (calorific value, etc.) are calculated by the characteristic equation (support vector regression equation) that is described later.
3. Conversion from sensor signals to output values
This section describes the method of identifying the characteristic equation necessary for calculating output values from the sensor signal, and the characterization of sensors in order to apply the identified equation (by modifying inputs) to individual calorimeter units.
3.1 Calculating the thermal conductivity based on natural gas composition
The thermal conductivity of natural gas is calculated by the Wassiljewa equation [2] using the coupling coefficient of each component obtained by the Lindsay-Bromley approximate equation [2]. These are empirical formulas and have approximation errors, but the calculated thermal conductivity has a good correlation with the actually measured heat loss coefficient, as shown in figure 3 [1].
3.2 Simulating the sensor output signal based on natural gas composition
When the voltage applied to the sensor in the circuit shown in figure 2 is V1, the power Ph applied to the sensor can be expressed, from equation (1), by the heat loss coefficient C and the sensor temperature Th.
Ph = V12/Rh = C (Th - T0) Equation (2)
Rh: Sensor resistance (Ω)
The sensor resistance Rh can be expressed by the following equation.
Rh = Rh20 (1 + α20 (Th - T0) + β20 (Th - T0)2) Equation (3)
Rh20: Sensor resistance at 20 °C (Ω)
α20: Primary temperature coefficient of resistance (ppm/°C)
β20: Secondary temperature coefficient of resistance (ppm/°C)
From equations (2) and (3), the operating point temperature Th at which the sensor reaches thermal equilibrium is obtained. Th is substituted into equation (3) again to calculate Rh. Then, sensor output voltage Vout is obtained by the following equation.
Vout = V1 (1 + R1 / Rh) Equation (4)
We developed a simulation program that calculates the sensor signal of a gas mixture with arbitrary composition using this method, and utilized it for identifying the characterization equation.
3.3 Support vector regression
For the calorimeter, the characteristic equation was identified using a method that utilizes support vector regression, which is a method of nonlinear analysis. The features of the equation are as follows.
(1) Error ratio satisfies the product specifications
The characteristic equation was identified using output values (calorific value, etc.) that were theoretically calculated from representative gas compositions. These are the true values. The characteristic equation with the smoothest curve that achieved the specified accuracy of output was generated.
(2) Structure suitable for high-speed calculation
The number of orders and terms of the identified characteristic equation is suitable for high-speed calculation (measurement time: several seconds) with low power consumption, as required for onsite industrial instruments.
3.4 Identifying the characteristic equation
Based on the sensor output signal simulated in 3.2 and the true value calculated from the representative gas compositions, a characteristic equation expressing the relationship between the sensor signal and the output value that satisfies the specified accuracy was identified using support vector regression.
Because the component ratio varies depending on the natural gas, it was necessary to check the correlation of the sensor signal and the output value for all gas component combinations within the measurable composition range in order to identify the characteristic equation.
For the natural gas model of our calorimeter, for example, the measurable composition range is as follows.
80 to 100 mol % of methane
0 to 11 mol % of ethane
0 to 5 mol % of propane
0 to 2 mol % of butane
0 to 7 mol % of nitrogen
0 to 2 mol % of carbon dioxide
If we were to change the ratio of the above six components in increments of 1 %, there would be tens of thousands of compositions. Since it is difficult to determine the correlation between the sensor signal and the output value for all possible compositions, we simulated the correlation of input and output values for many compositions and selected several that can serve as representatives of all compositions (we call these typical gas compositions SVR gases).
The characteristic equation was identified using the sensor signal for the selected SVR gases and the true values as input values.
Figure 4 shows the error ratio of output values calculated by the characteristic equation which was identified based on 40 SVR gases that can be measured by the natural gas model. We checked more than 500 compositions that are in the measurable composition range. The error of all output values, including those of the SVR gases, is within the specified allowable error range (± 1.2 % of the reading).
The characteristic equation is a cubic equation (5 variables).
To obtain reliable measurement results even when environmental conditions change, data to deal with changes in ambient temperature and pressure was added to the equation inputs.
3.5 Characterization
In order to modify the inputs of the characteristic equation for individual calorimeter units whose sensor varies in its characteristics, it might be thought necessary to obtain sensor signals from each unit by actually introducing SVR gases. However, preparing dozens of mixed gas compositions to obtain data is not realistic, because it would require considerable cost and manpower.
In order to solve this problem, actual gas measurements to identify the equation were omitted for our calorimeter. The simulated sensor signal for SVR gases was corrected according to the sensitivity of the sensor, and a characteristic equation with modified inputs for individual units is identified using the corrected data.
Since the MEMS sensor described in 2.1 has extremely small variations in its physical shape, and because its resistance temperature characteristics are highly linear, the difference between individual sensors is quite small if the rate of sensor signal change, which follows gas composition change, of two reference gases is normalized. Therefore, by measuring the sensor signal of two reference gases, it is possible to estimate the sensor signal of each SVR gas from equation (5).
Correction value = A × {(E/C - 1) × [(B/A - 1) / (D/C - 1)] + 1} Equation (5)
A: Sensor signal for reference gas 1 (value measured by individual calorimeter)
B: Sensor signal for reference gas 2 (value measured by individual calorimeter)
C: Sensor signal for reference gas 1 (calculated value)
D: Sensor signal for reference gas 2 (calculated value)
E: Sensor signal for individual SVR gas (calculated value)
Since it is possible to characterize sensors by correcting the results of simulation in this manner, there is no need to actually prepare SVR mixed gases to estimate the sensor signal. Accordingly, the number of SVR gases can be increased without limit when identifying the characteristic equation, which makes it possible to identify a reliable characteristic equation that is highly compatible in a wider composition range.
4. Example of Measurement Results
Figure 5 shows the results of measuring 40 test gases with different compositions consisting of C1–C6, hydrocarbons, N2, and CO2. The figure compares the values measured by the calorimeter and the true values calculated from the composition.
The achieved measurement accuracy is ± 1.5 % of the reading (rdg.) or less for the superior calorific value (SCV) and ± 3 rdg. or less for the methane number.
Figures 6 and 7 show error variation in the values of five test gases that were measured in fluctuating ambient temperature (-10 °C to 50 °C) and atmospheric pressure (983 hPa to 1043 hPa). Even if the ambient temperature and atmospheric pressure change, the calorimeter can measure gases reliably.
5. Example of Measurement System
Figure 8 shows a sample measurement system. Azbil's calorimeter is more compact than conventional calorimeters and can be installed in a small space. Incorporation in equipment as a part is under discussion.
6. Conclusion
By changing the sensor temperature in five steps in order to measure the thermal conductivity of gas at different temperatures, and by improving the method of converting sensor signals to output values, it is now possible to precisely measure the calorific value, methane number, etc., of natural gas using only a single MEMS sensor.
With major changes anticipated for the gas market in the future, the demand for and importance of measuring the calorific value and other parameters of natural gas and LNG are increasing.
We look forward to developing products that measure more gas parameters with higher accuracy and that meet market needs.
References
[1] Yasuharu Ooishi, “Technology for Heat Value Measure-ment of Natural Gas by Applying MEMS Sensor, and Its Foresight” (in Japanese), 57th Japan Automatic Control Conference (2014) of the Society of Instrument and Control Engineers.
[2] The Japan Society of Mechanical Engineers, Heat Trans-fer, 3rd edition (1975), p. 312.
Author affiliation
Ryuuichi Hamaguchi, IAP Development Department, Advanced Automation Company, Azbil Corporation
■Contact: Azbil Corporation(http://kr.azbil.com)

